The Sales invoicing graphs provide a quick overview of the sales invoicing status.
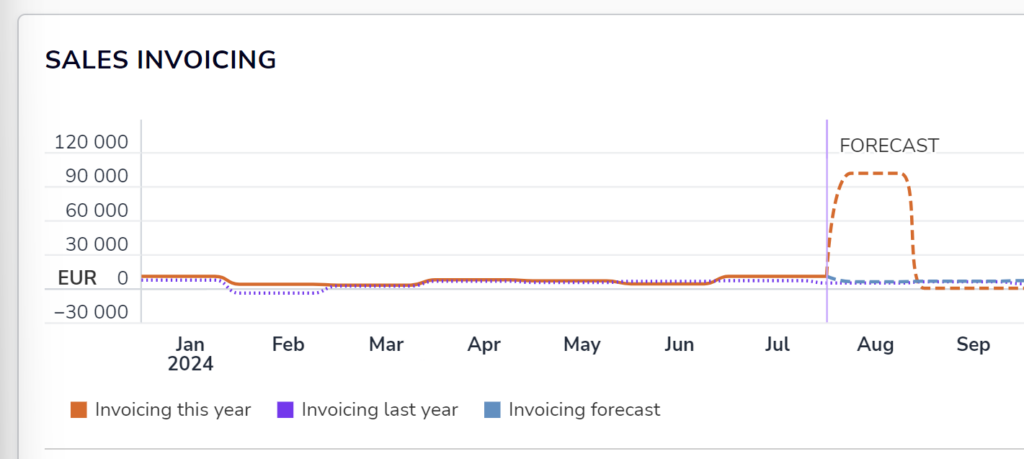
From the trend graph, you can see how sales have developed monthly, as well as a forecast based on the previous and current year. Navigate forward and backward in the monthly view using the arrows in the upper right corner of the graph.
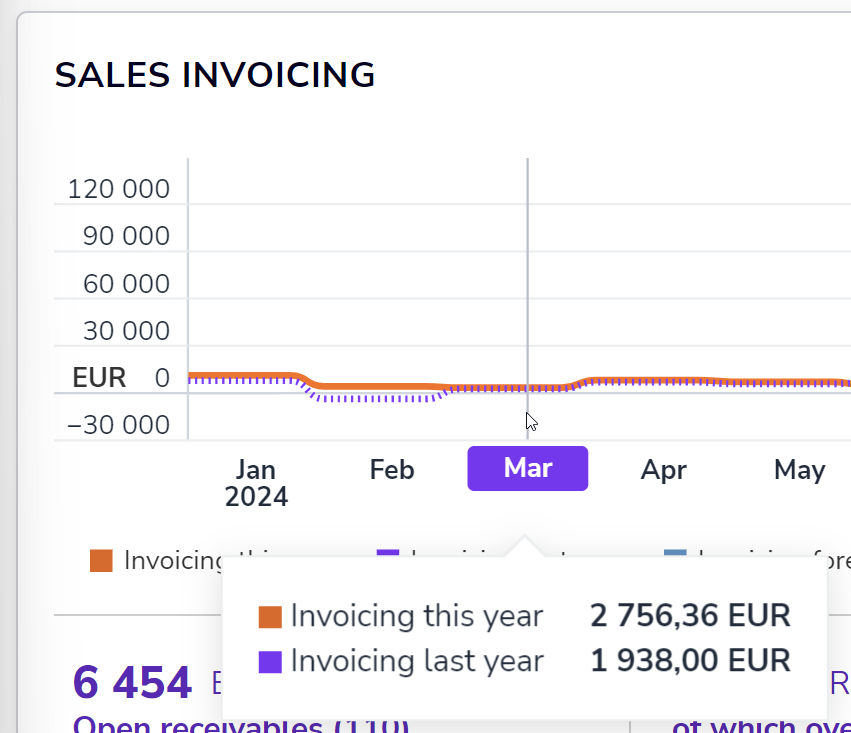
Hover over a specific day on the graph to see a detailed summary of the sales invoices, as well as a comparison to the previous year.
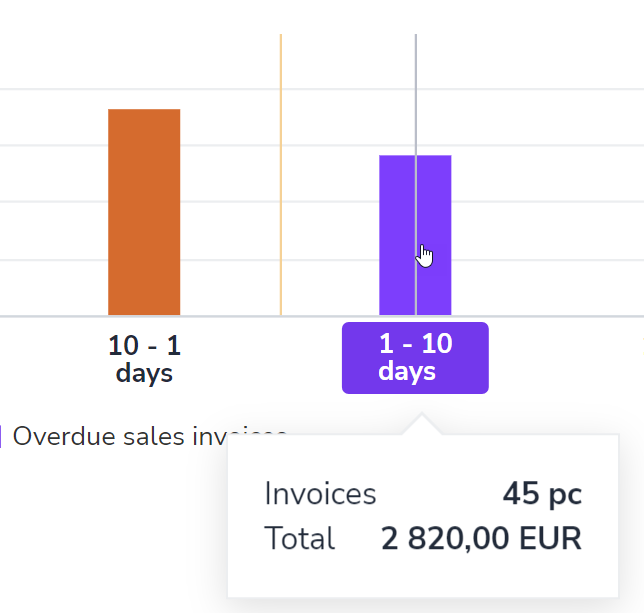
Open receivables (sent but not yet paid) quickly show the current sales invoices. …of which overdue displays the sales invoices that are already overdue, but payment has not been received. You can switch between a chart and a list view.
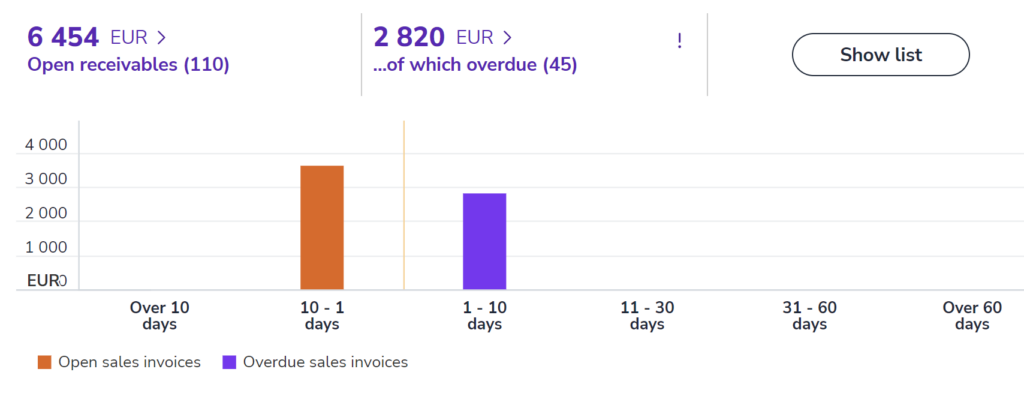
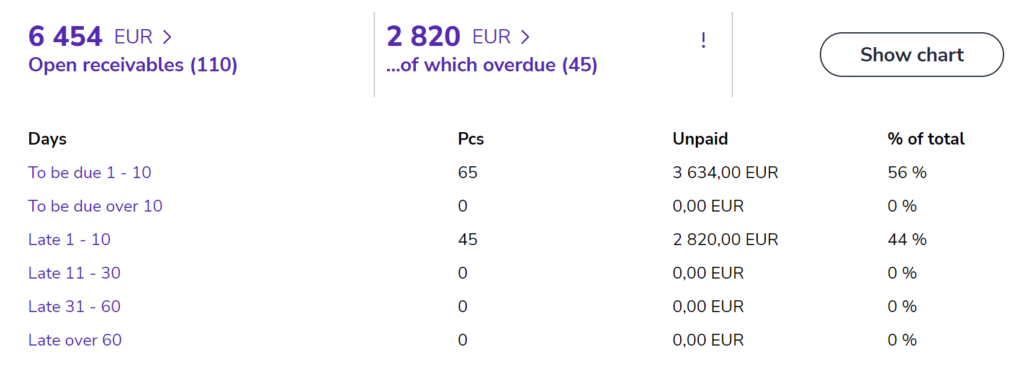
The age distribution shows the sent and unpaid sales invoices according to their due date. Hover over a specific day to see a detailed summary of the number and total amount of sales invoices.